Day 35: Markets Eye the Cost of a Record Shutdown
November 3, 2025
Macro Overview
The U.S. government shutdown has now reached Day 35, surpassing the record set in 2019 and becoming a live test of the nation’s fiscal credibility, data continuity, and market resilience. Roughly 1.4 million federal employees remain unpaid or furloughed. The CBO estimates a 1–2 percentage-point drag on Q4 GDP 1 as missed federal paychecks, frozen USDA-backed mortgages, and delayed SNAP disbursements ripple through local economies. Safety-critical workers—air-traffic controllers, TSA staff—continue without pay, elevating operational risk in transportation and logistics sectors.2
The suspension of official data releases has created a “data blackout”, forcing policymakers and investors alike to rely on private indicators and market-implied proxies to gauge economic momentum.3

Market Response and Asset Trends
Cross-asset behavior has been measured but directionally cautious, revealing a selective risk-off rotation rather than a wholesale liquidation.

Short-end rates across Treasuries, bills, and repo markets moved higher as post debt ceiling issuance, collateral scarcity, and heightened cash demand pressure funding costs. The rise wasn’t limited to government bonds, front-end spreads and SOFR-linked instruments also widened modestly, reflecting tighter system liquidity and an increased premium for overnight funding.
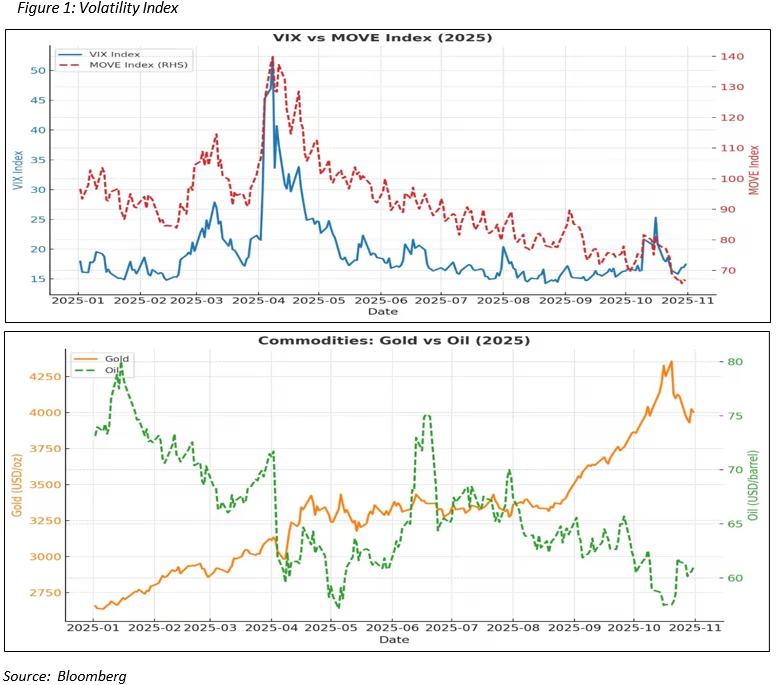
Meanwhile, volatility gauges such as the VIX and MOVE Index (Figure 1) stayed contained signaling investor confidence that dislocations were technical, not systemic, and would normalize once fiscal operations resume.
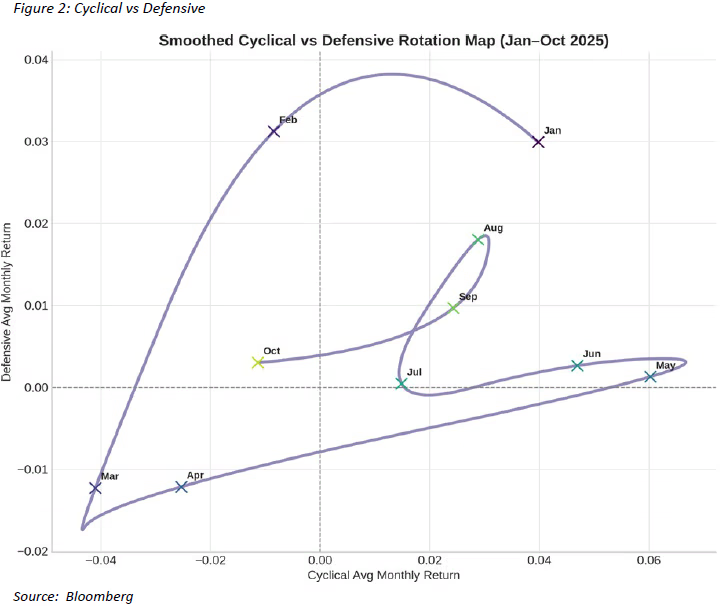
Equity markets advanced modestly but rotated decisively toward defensive sectors—Utilities, Health Care, and Consumer Staples—while Tech, Industrials, and Financials underperformed following a mid-year leadership stretch. The sector rotation data and rotation map (Figure 2) illustrate this progression:
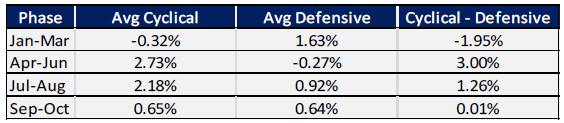
Jan–Mar:Defensives led (+1.6%) vs cyclicals (–0.3%) → risk-off positioning.
Apr–Jun:Risk-on rebound (+2.7% cyclicals vs –0.3% defensives).
Jul–Aug:Continued cyclical leadership (+2.2% vs +0.9%).
Sep–Oct:Convergence (+0.6% each) → renewed bid for defensives
This late-cycle pattern underscores investors’ pivot toward earnings resilience and liquidity preservation, consistent with historical shutdown-period playbook.
Fed & Funding | QT Ends, Liquidity Remains Tight
At its October meeting, the Fed delivered a second consecutive 25 bp cut, bringing the target band to 3.75–4.00%, citing employment risk and the ongoing data blackout. QT will formally end December 1, 2025, after shrinking the balance sheet by roughly $2.4 trillion, to ≈ $6.6 trillion in total assets. All maturing Treasuries and MBS will now be reinvested into T-bills, halting net liquidity withdrawal.4
Administered rates—IORB 3.90%5, ON RRP 3.75%—were adjusted within the new corridor to stabilize front-end funding. Still, repo utilization remains high, and market participants view “ample liquidity” as theoretical rather than functional.
Chair Powell reaffirmed a data-dependent stance: further easing is not pre-committed, and internal debate continues on the appropriate pace of normalization.
Institutional Takeaways & Investment Strategy
- Liquidity: QT is done, but funding tightness persists; collateral scarcity and T-bill issuance will keep repo demand elevated.6
- Rates & Fiscal: Policy risk now transmits through funding rather than policy signaling—markets must price fiscal gridlock as a volatility input.
- Positioning: Favor quality balance sheets and short-duration assets; maintain tactical liquidity. Avoid over-leveraged cyclicals until fiscal visibility improves.
- Sectors: Defensives should retain a bid while cyclical rotation opportunities will likely be short-lived and event-driven (Figure 2).
Key Message:
The end of QT marks the close of mechanical tightening, not a return to easy money. For institutions, 2025’s lesson is that policy paralysis equals funding volatility—and discipline in liquidity management now defines outperformance.
3https://www.ncsl.org/in-dc/federal-government-shutdown-what-it-means-for-states-and-programs
4https://www.federalreserve.gov/newsevents/pressreleases/monetary20251029a.htm
5https://fred.stlouisfed.org/series/IORB/
6https://seekingalpha.com/article/4836730-fed-qt-ends-what-does-that-mean-for-markets
↑ Back to top